
In this note, I'll guide you through the concepts of libraries, packages, and modules in Python, along with their practical applications. I'll also introduce some widely used AI programming libraries, including Pandas, NumPy, Matplotlib, and Seaborn, and provide insights on how to effectively utilize these libraries.
I know this note is kind of theoretical and boring, but it is pretty necessary for starters who’ve just picked up AI programming (like me!). Why not just give it a read?
Overview of AI Programming Libraries
Libraries, as you might know, are physical spaces filled with books that contain knowledge from various fields, such as science, literature, and research. Python libraries are no different. They are are collections of functions and tools designed to perform specific tasks within Python programming.
Python Libraries
Let's delve into some fundamental concepts of Python libraries: variables, functions, modules, and packages. These can be described in the following chart:
Let's break it down. A program is composed of numerous variables and functions. If it's designed for reusability, it's referred to as a module. A package is a collection of modules that share similar functions. A library is a repository that houses all these packages, providing a collection of pre-written functions and objects that programmers can leverage to enhance coding efficiency.
- Modules: A program designed for reuse.
- Packages: A collection of modules with similar functions.
- Library: A collection of packages.
Using libraries in Python generally involves the keywords import, from, and as. The import keyword is used to bring a library into a program, and as can be used to rename a library for easier use. The from keyword can be used to import specific objects from a library.
import math # using module math
pie = math.pi
print("Value of pi: ", pie)
Value of pi: 3.141592653589793from math import pi # using variable pi
print("Value of pi: ", pi)Value of pi: 3.141592653589793from math import * # using all
print(pi)
print(factorial(6))3.141592653589793
720import random as rd
rd_val = rd.random()
print(rd_val)0.04592068876016775Common AI Programming Libraries
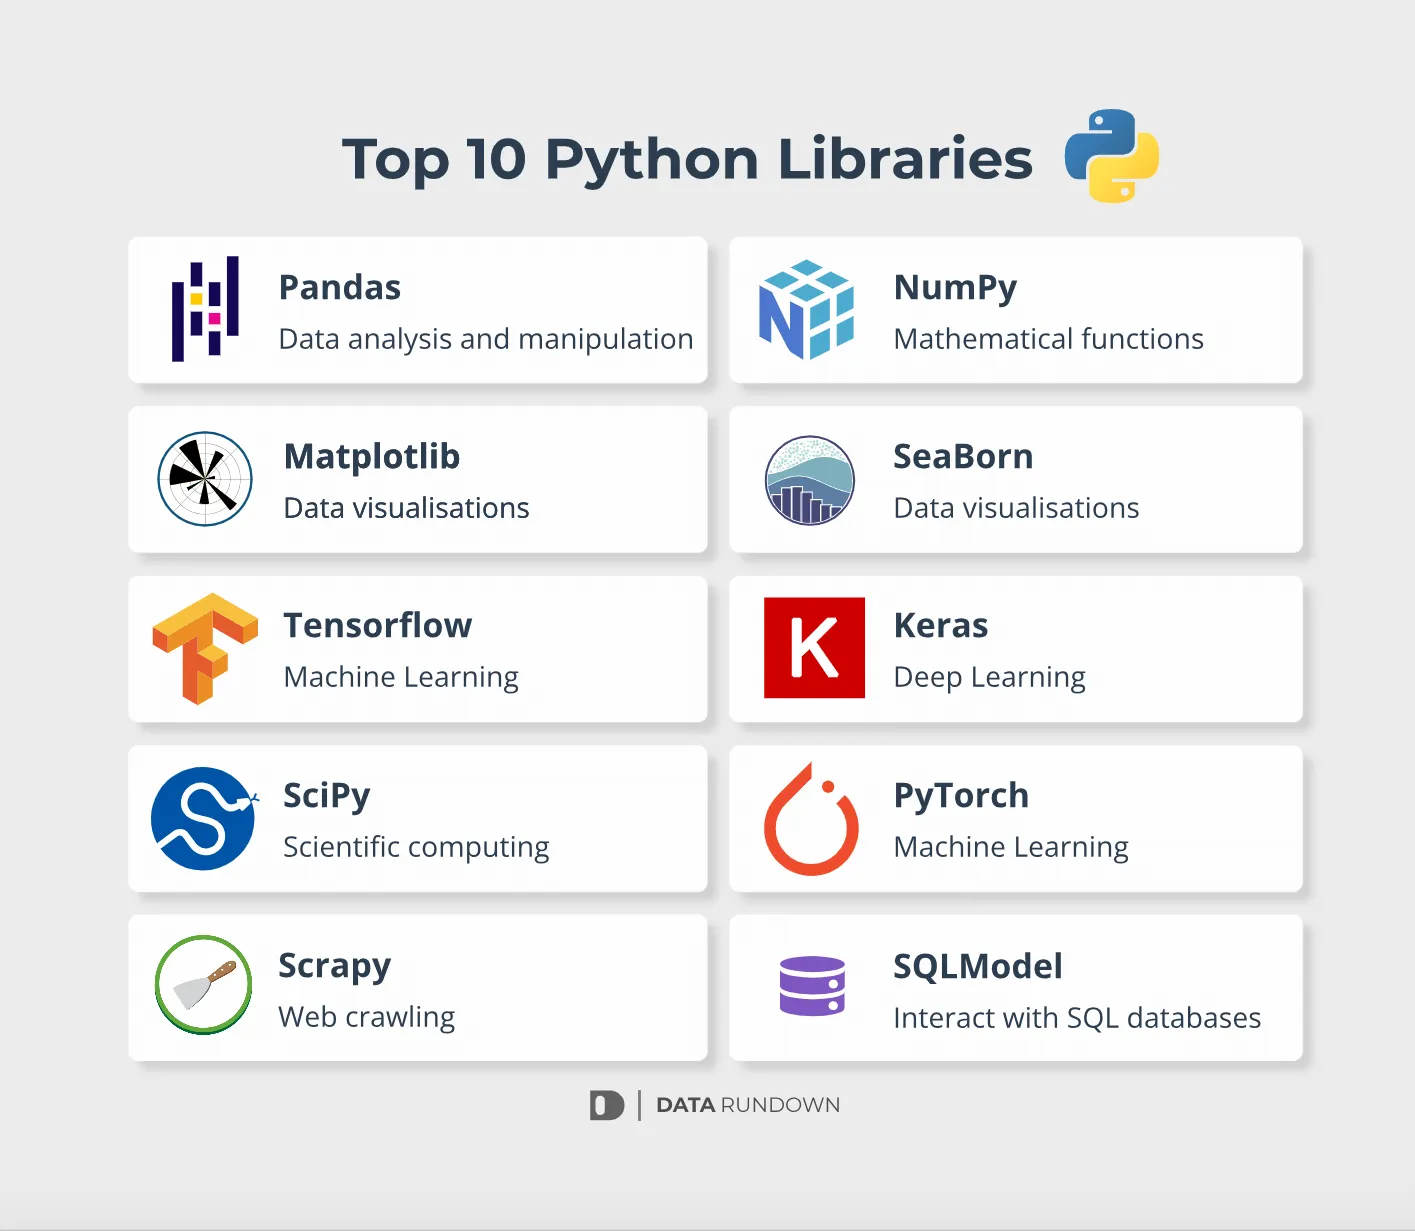
Let’s look at the top 10 Python libraries. The first eight libraries in the list are the most popular libraries for AI programming, especially in Machine Learning and Deep Learning.
In this note, I’ll focus on the top 4 libraries - Pandas, NumPy, Matplotlib, and Seaborn.
Managing, analyzing, and performing statistical operations on data using Pandas
Pandas Overview

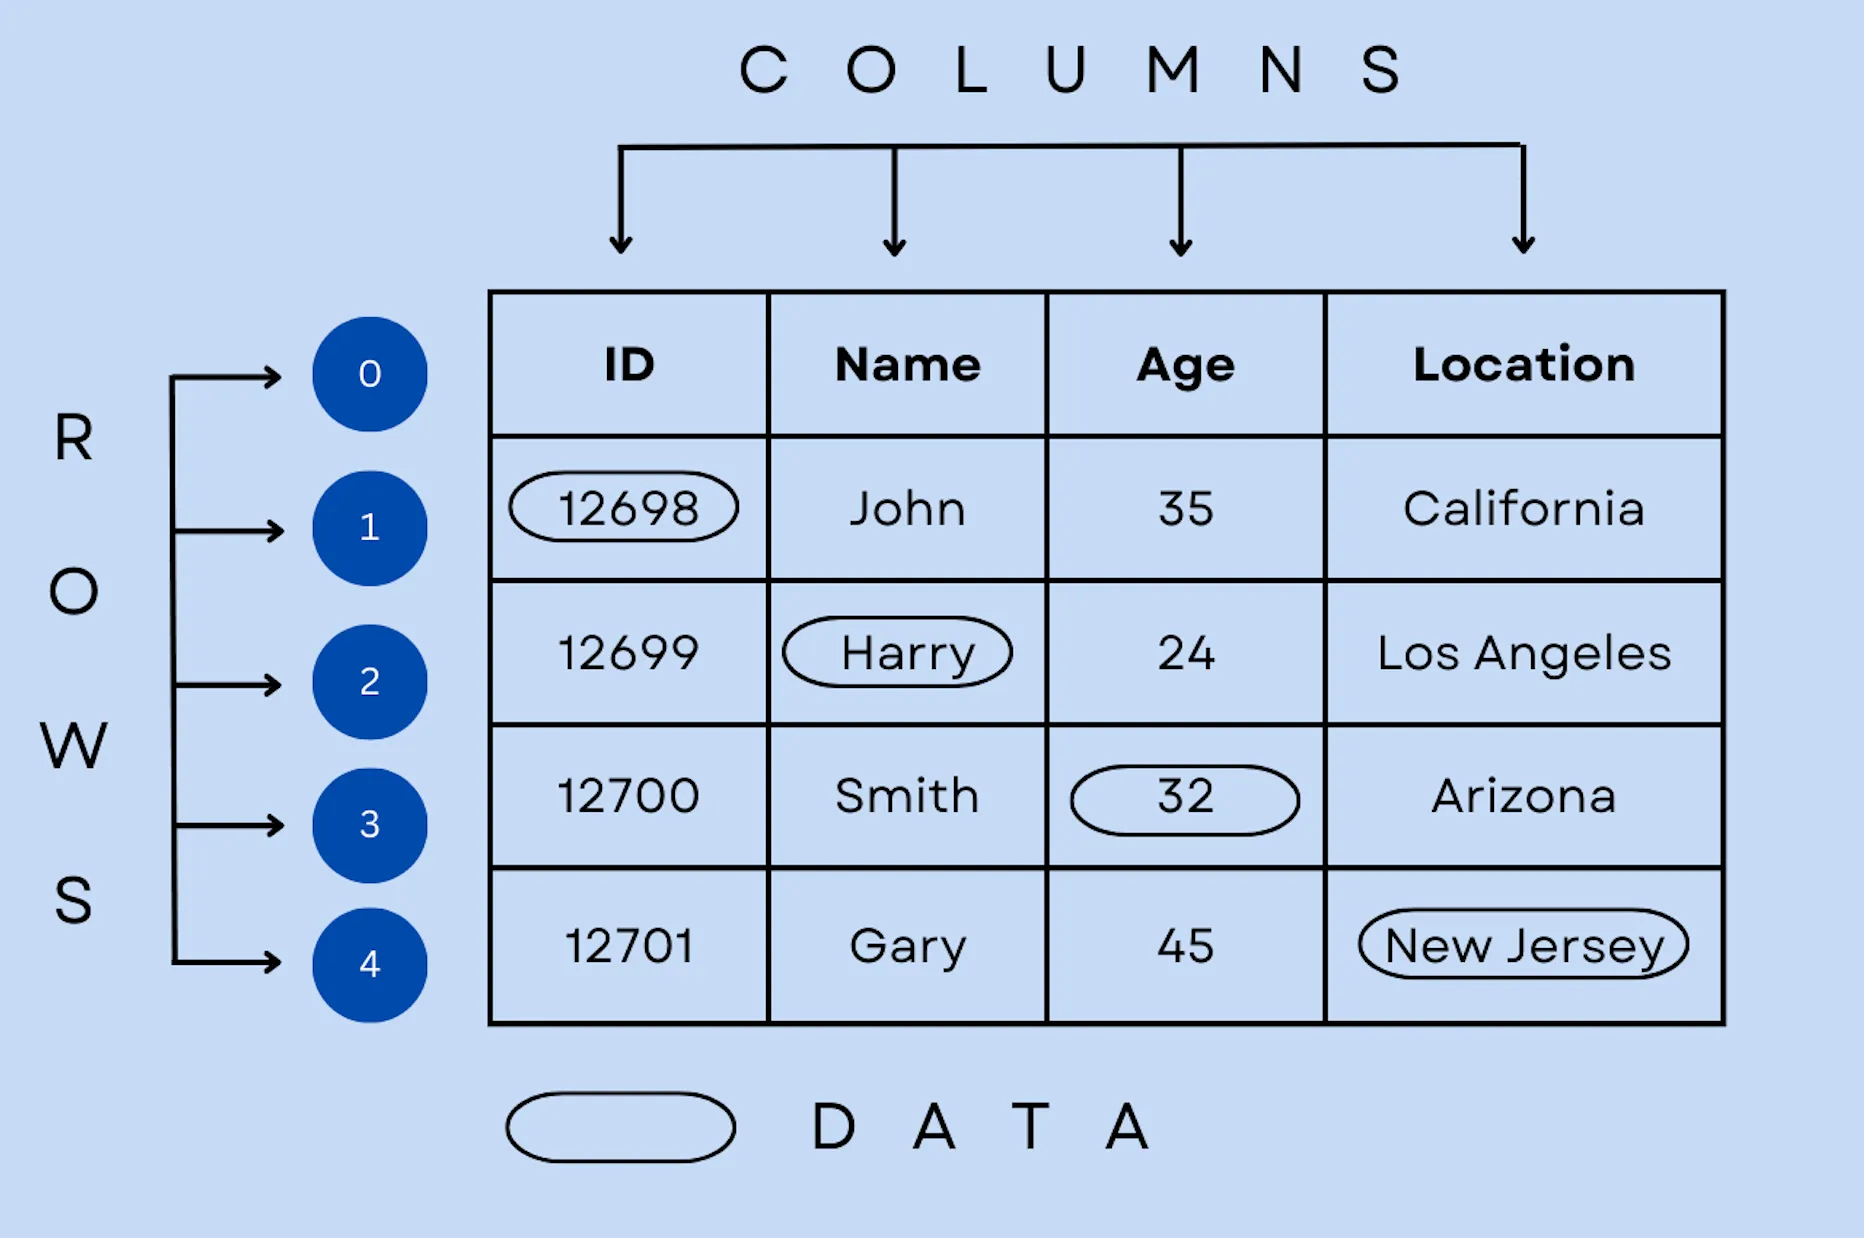
Pandas aims to provide users a method of displaying data using tables. Each data can be indexed by rows or columns, like in the table in the above picture. This library is used for data management, analysis, and statistics, and to presents data.
You can install this library using the terminal command pip install pandas.
pandas documentation — pandas 2.2.3 documentation
Data Structures in Pandas
The Series Data Structure
These are one-dimensional arrays with labeled indices.
import pandas as pd

series_a = pd.Series([1, 7, 2])
print(series_a)Series consists of three integer datapoints.0 1
1 7
2 2
dtype: int64import pandas as pd
series_a = pd.Series([1, 7, 2],
index = ["a", "b", "c"])
print(series_a)Series consists of three integer datapoints with labeled indices.a 1
b 7
c 2
dtype: int64import pandas as pd
marks = { "day1": 20, "day2": 70, "day4": 90 }
series_a = pd.Series(marks)
print(series_a)Series from a dictionary.day1 20
day2 70
day3 90
dtype: int64The DataFrame Data Structure
These are two-dimensional arrays with labeled rows and columns, similar to a spreadsheet or an SQL table.
import pandas as pd

data = {
  "calories": [420, 380, 390],
  "duration": [50, 40, 45]
}

df = pd.DataFrame(data)
print(df)DataFrame with two columns, 'calories' and 'duration', and index the rows from 0. calories duration
0 420 50
1 380 40
2 390 45import pandas as pd
data = {
"calories": [420, 380, 390],
"duration": [50, 40, 45]
}
df = pd.DataFrame(data)
# access 'calories' column
print(df["calories"])0 420
1 380
2 390
Name: calories, dtype: int64import pandas as pd
data = {
"calories": [420, 380, 390],
"duration": [50, 40, 45]
}
df = pd.DataFrame(data)
print(df.loc[0])
print(df.loc[[0, 1]])DataFrame to access a group of rows or columns, in this case we’re accessing the 1st and 2nd row.calories 420
duration 50
Name: 0, dtype: int64
calories duration
0 420 50
1 380 40Pandas Operations
We can also perform read-write operations on Excel spreadsheets, CSV, and JSON files.
Some other operations include:
- Viewing data:
head(),to_string() - Data analysis and statistics:
info(),describe(),corr(), etc. - Accessing data:
[],.loc[],.iloc[] - Updating data:
dropna(),fillna()
Numerical Operations using NumPy
NumPy Overview
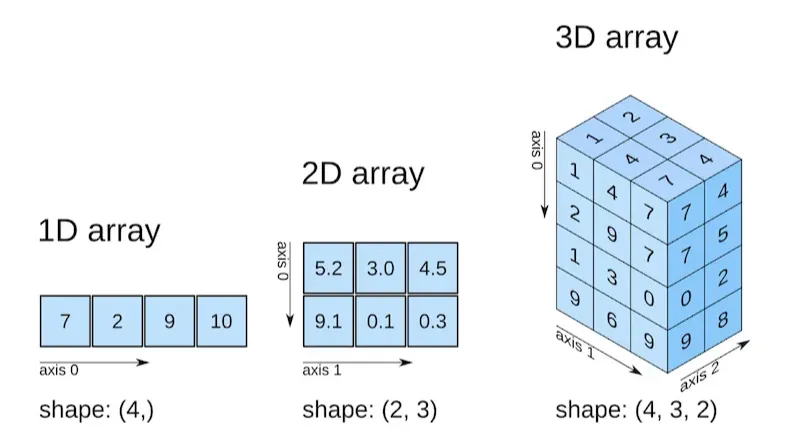
This library is used for scientific computing with sequences and matrices. NumPy works with N-dimensional arrays (ndarray), which are similar to lists, but can have multiple dimensions. NumPy arrays have a specific data type for all elements.
You can install this library using the terminal command pip install numpy.
NumPy documentation — NumPy v2.2 Manual
Data Structures in NumPy
The ndarray Data Structure
import numpy as np

arr = np.array([1, 2, 3, 4, 5])
print(arr)
print(type(arr))[1 2 3 4 5]
<class 'numpy.ndarray'>import numpy as np
list_a = [[1, 2, 3, 4, 5], [6, 7, 8, 9, 10]]
arr_a = np.array(list_a)
print('5th element on 2nd row: ', list_a[1][4])
print('5th element on 2nd row: ', arr_a[1][4])
print('5th element on 2nd row: ', list_a[1, 4])5th element on 2nd row: 10
5th element on 2nd row: 10
5th element on 2nd row: 10import numpy as np
arr = np.array([1, 2, 3, 4, 5, 6, 7])
print(arr[1:5:2]) # step = 2[2 4]Unlike Python lists which can store elements of various types, NumPy arrays have a specific data type for all elements. These are some of the data types for NumPy arrays:
-
i- integer -
b- boolean -
u- unsigned integer -
f- float -
c- complex float -
m- timedelta -
M- datetime -
O- object -
S- string -
U- unicode string -
V- fixed chunk of memory for other type (void)
import numpy as np

arr = np.array([1.1, 2.1, 3.1])
newarr = arr.astype(int) # 'i'
print(newarr)
print(newarr.dtype)[1 2 3]
int64import numpy as np
arr = np.array([1, 2, 3, 4], dtype='f')
print(arr)
print(arr.dtype)[1. 2. 3. 4.]
float32import numpy as np
arr = np.array(['1', 2, 3, 4, 5, 6, 7])
print(arr)['1', '2', '3', '4', '5', '6', '7']Operations on ndarray
Common array manipulations include:
- Shape:
shape,reshape(). - Initialization:
numpy.zeros(),numpy.ones(), etc. - Concatenation:
numpy.concatenate(),numpy.stack(), etc. - Splitting arrays:
numpy.array_split(),numpy.hsplit(). - Searching:
numpy.where(), etc. - Sorting:
numpy.sort().
Data Visualization Techniques with Matplotlib and Seaborn
Why Visualize Data?
Data visualization is all about representing data graphically, using charts, graphs, and images. Visualizing the data can provide valuable insights, which allows us to extract the most meaningful information from the data sets.
Before Training AI Models
- Analyze data distribution:
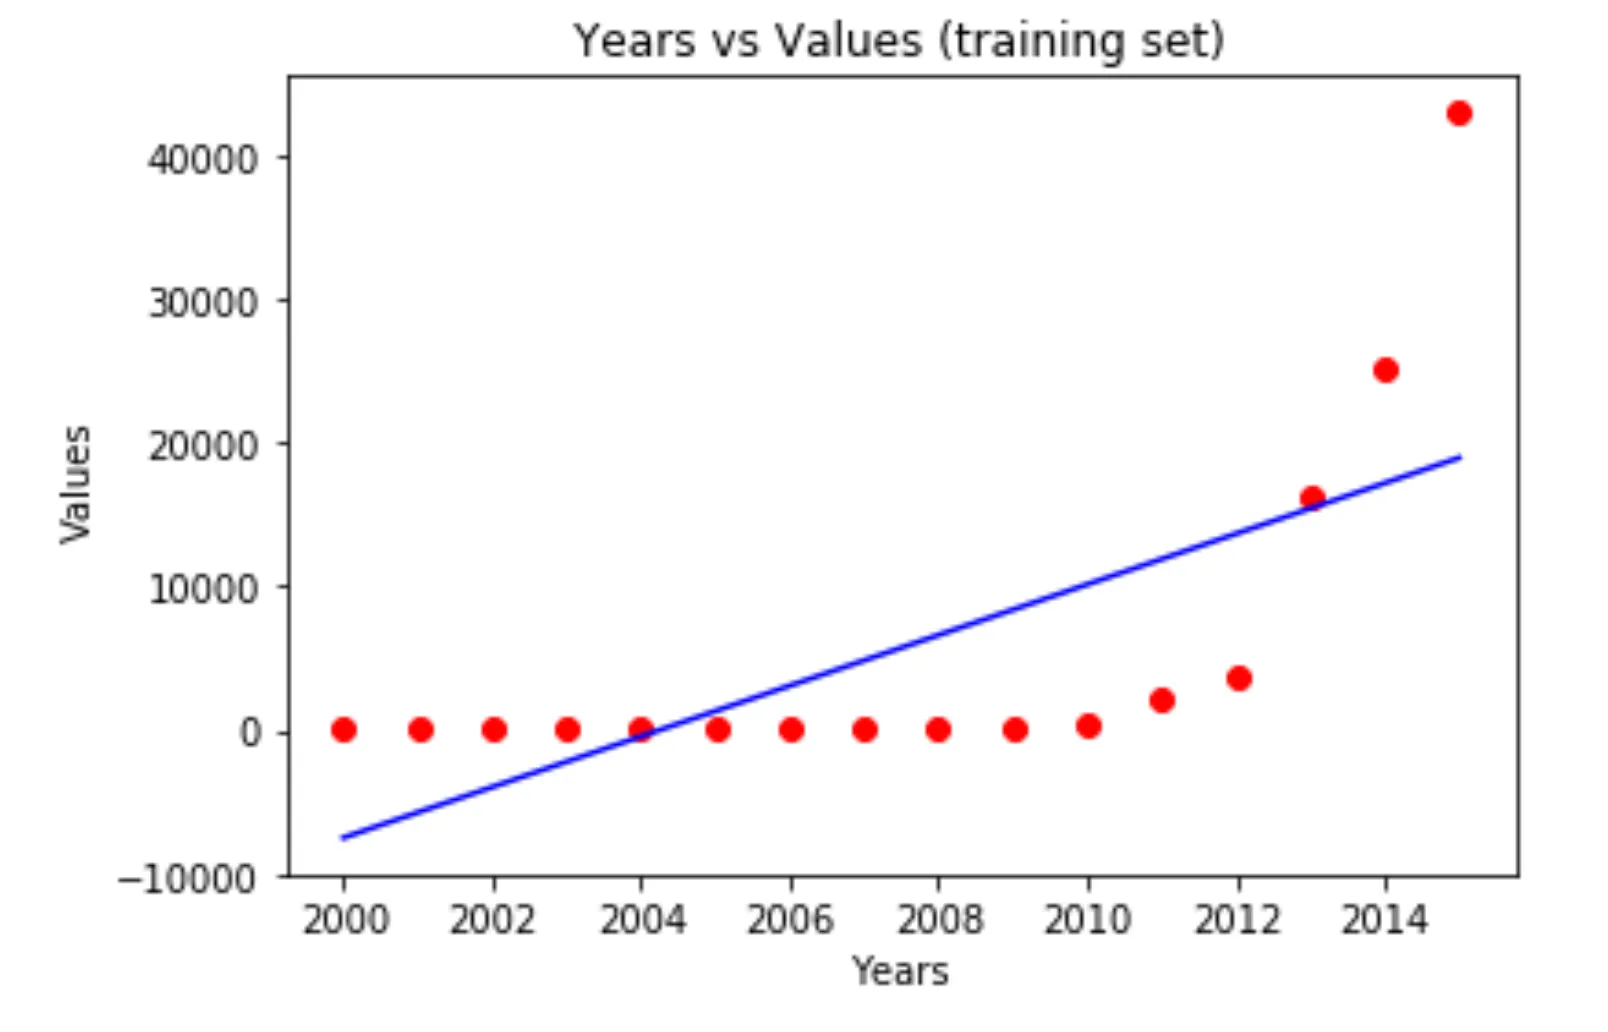
Let’s consider the plots. If we only view this data in a table, it's challenging to visualize its distribution on a Cartesian plane. In this instance, the data points (in red) are distributed almost in a straight line. Therefore, our goal is to train an AI model to predict data values that are approximately equivalent to those on the straight line.
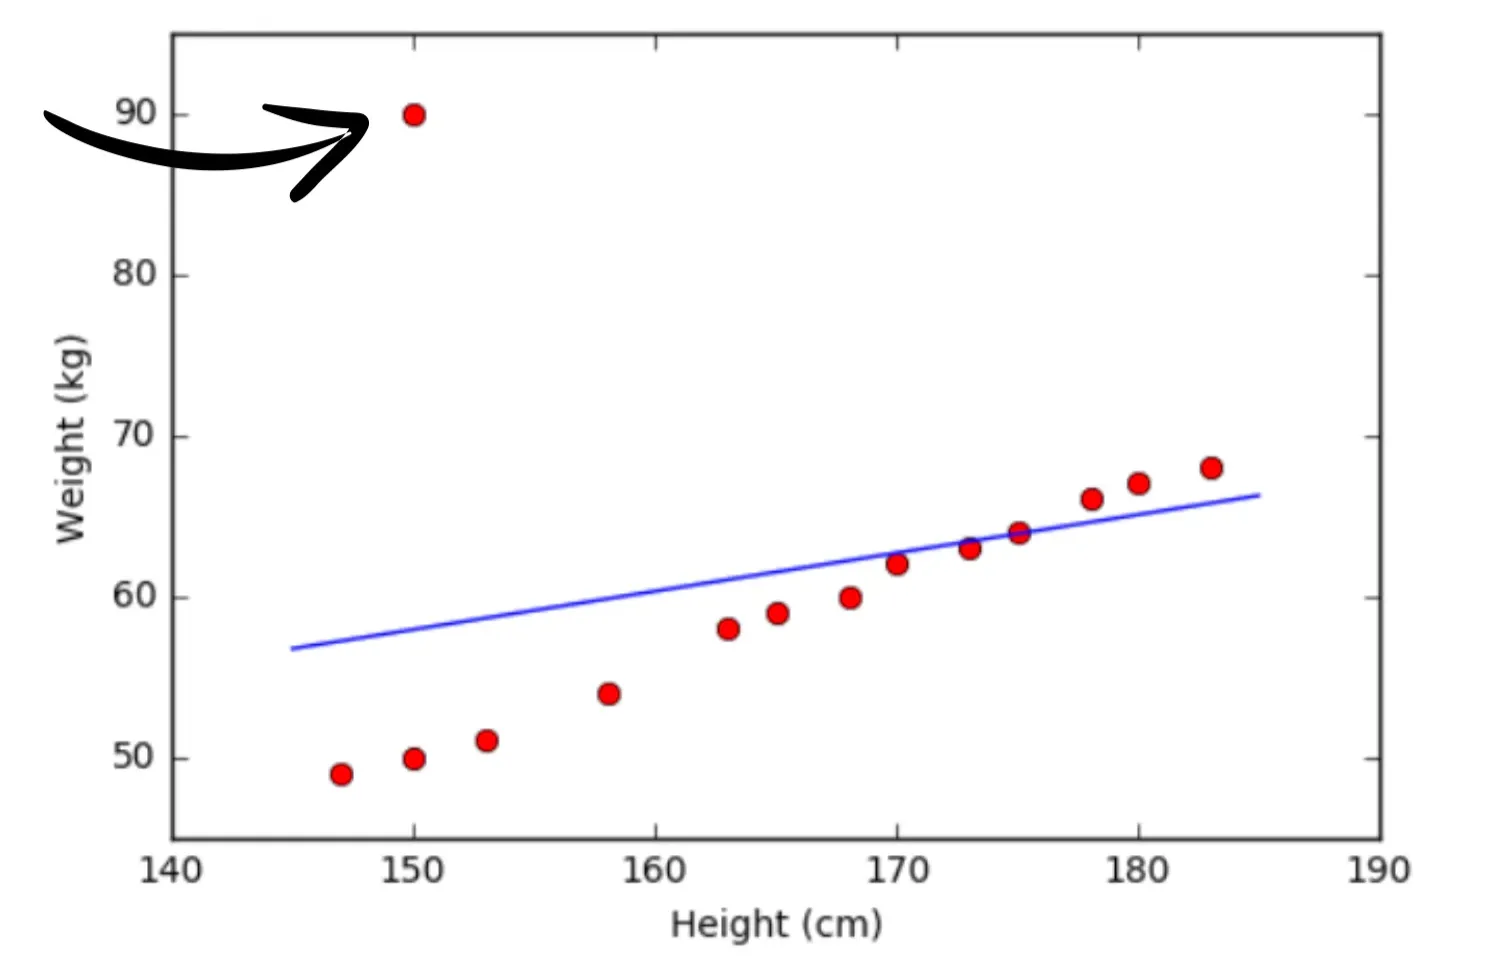
- Clean datasets by removing noise or outliers:
However, in the first example plot, there's an outlier data point—a value that lies outside the majority of the data points. The presence of this outlier causes the predicted values from your model, when viewed as a straight line, to deviate (as seen in the plot). This is because the predicted line must be the closest distance to every data point, including the outlier. By visualizing the data and removing the outliers, we acknowledge the loss of some data points, but our model can make more accurate predictions based on the remaining data points.
- Augment data if necessary.
During AI Models Training
Monitor the variation of the model over time:
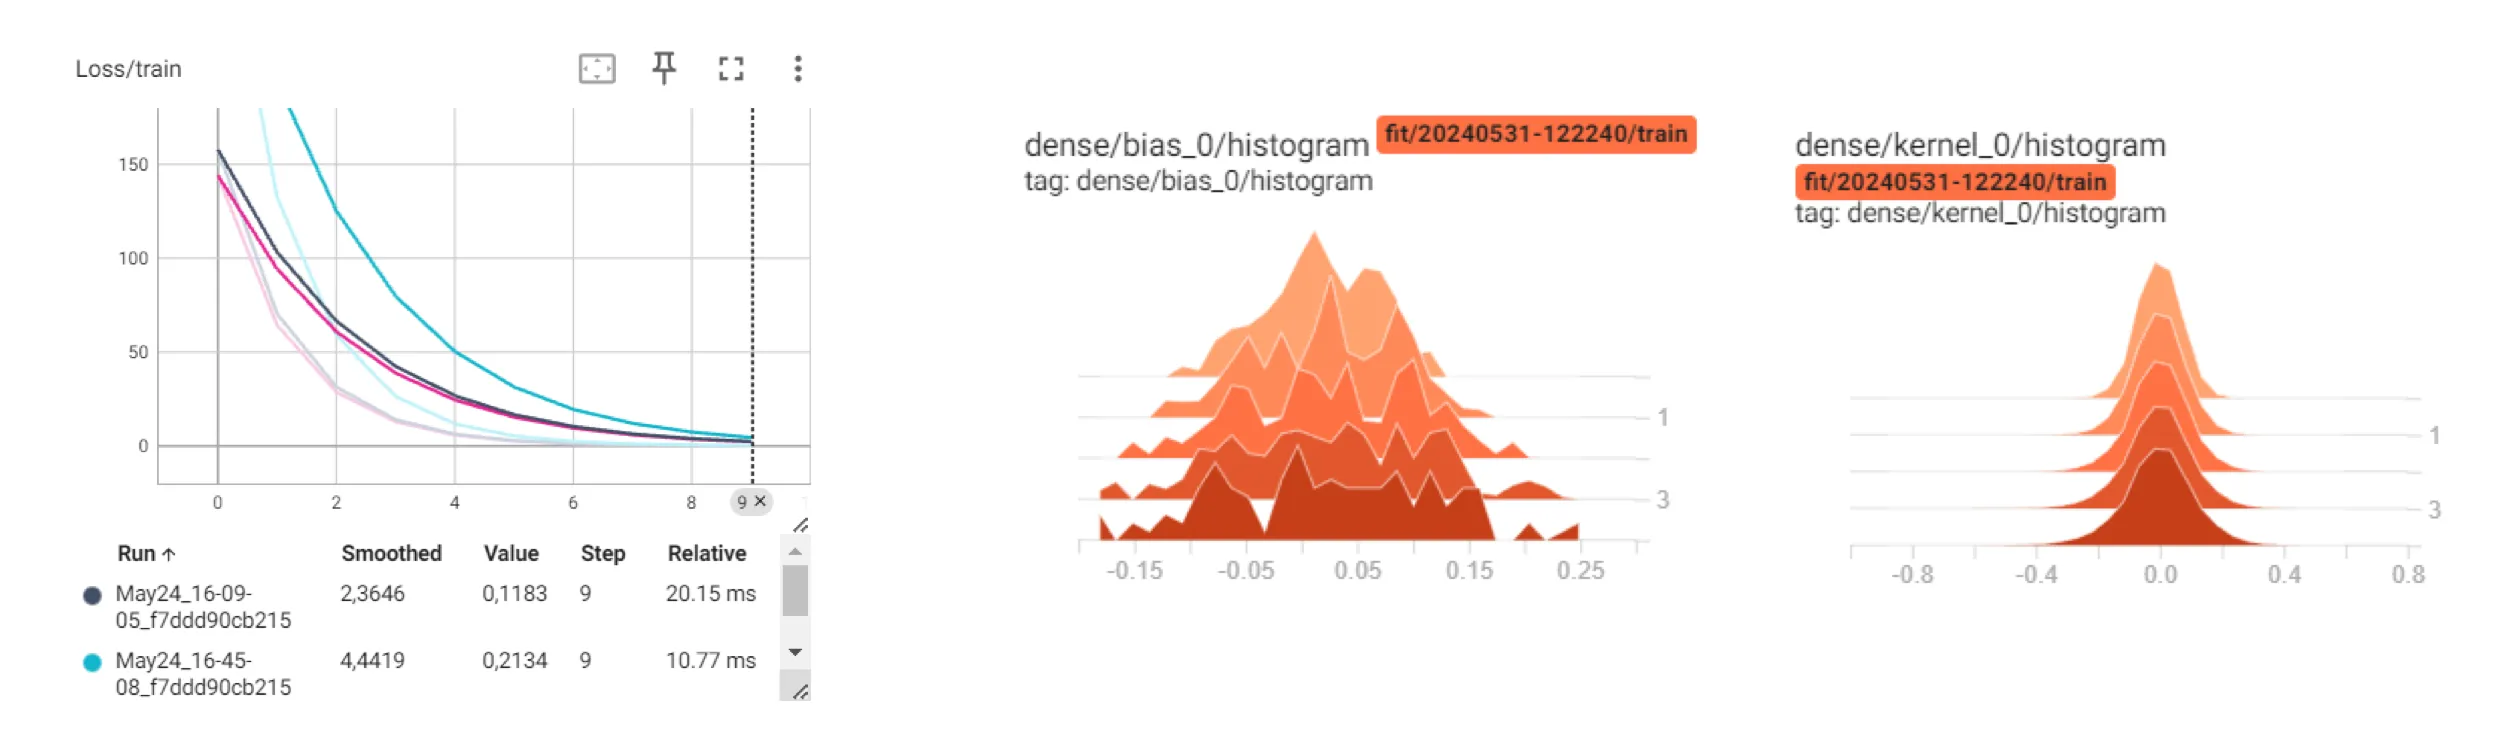
- When you've built an AI model, how can you ensure that it's actually learning or that the optimization of your model is effective? Typically, we monitor the loss curve during training and the accuracy curve during validation using a specific test dataset. If your model is improving, the loss curve decreases over time, while the accuracy curve increases. Visualizing these values in real-time provides valuable insights.
- However, there are instances when your model may become under-fitting or over-fitting. In such cases, it's crucial to monitor the parameter distribution, which are the values your model is expected to predict. By observing if these values change equally, you can identify potential issues and take necessary actions to improve the model's performance.
After Training AI Models
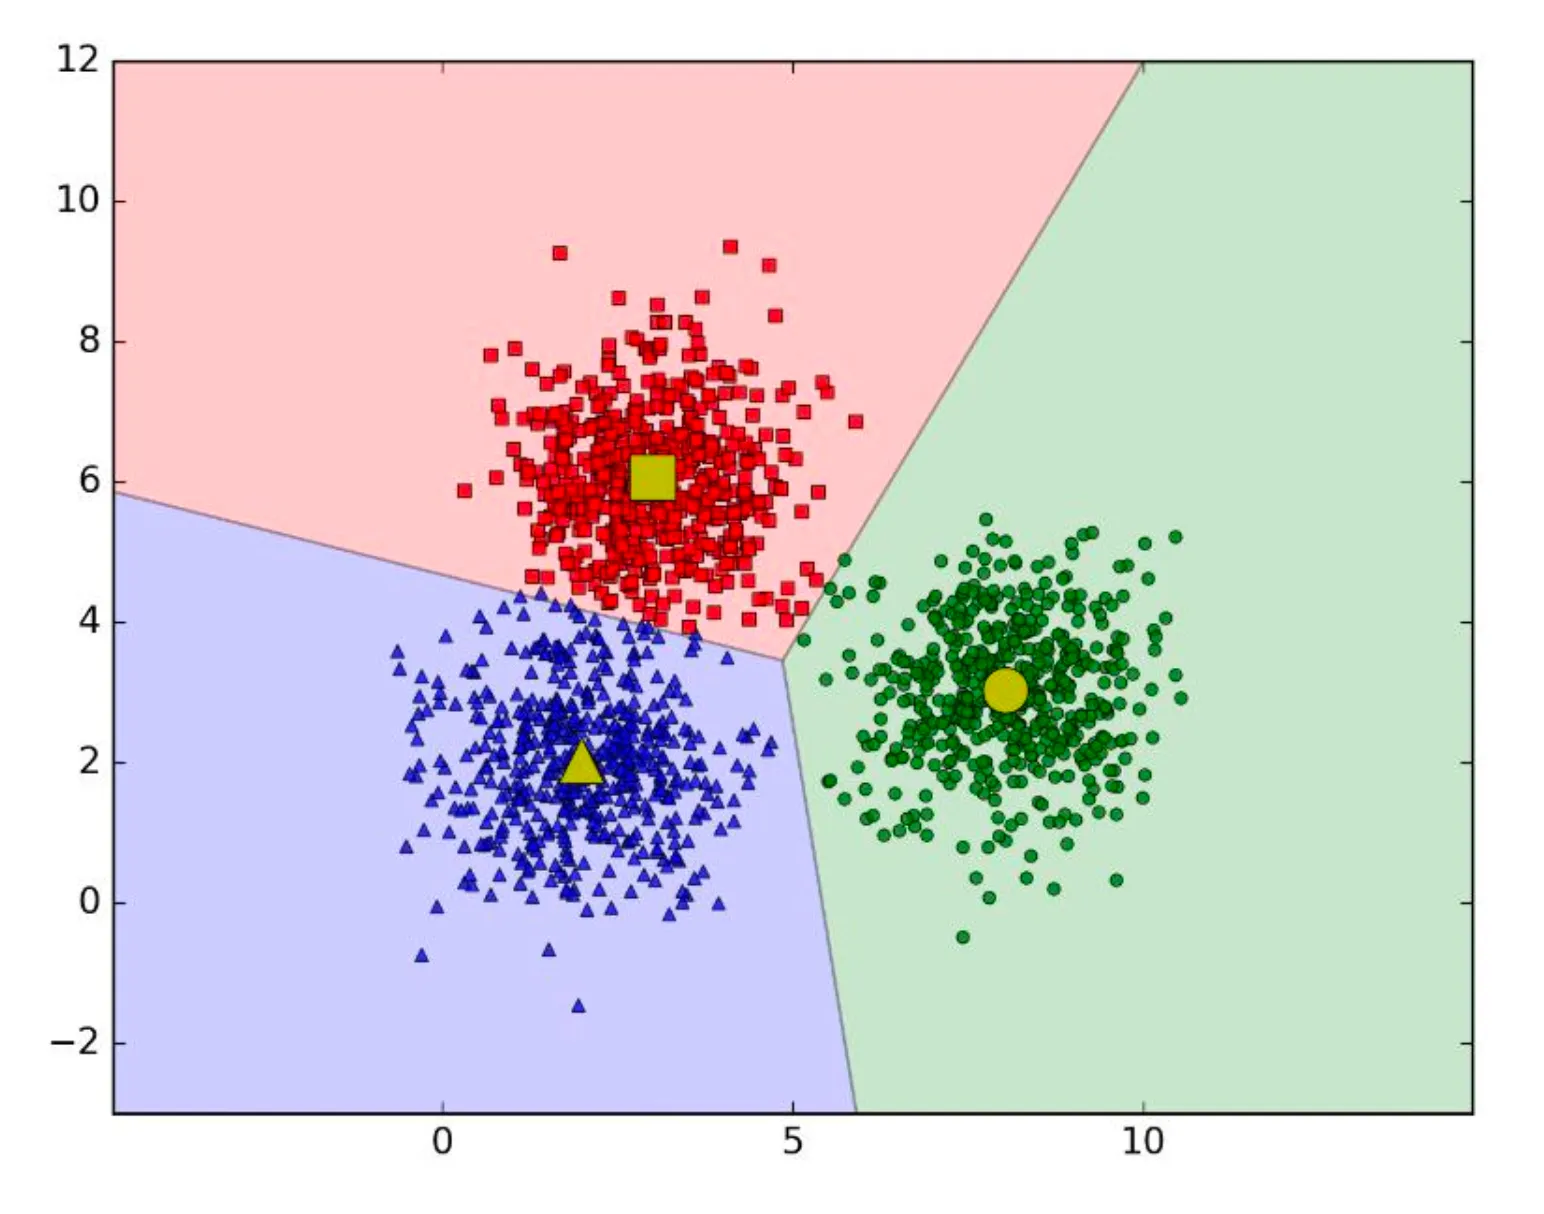
- Evaluate the results:
- Take a classification problem, for instance. Neighboring data points will be grouped into similar color groups. If you're displaying the data in tables, it becomes challenging for both analytical and statistical analysis, and it's also difficult to visualize the distances between them on a Cartesian plane.
- Perform qualitative analysis.
- For instance, consider a model that processes images and removes noise. To evaluate the quality of the processed image, you need to display the output image. This process allows you to identify areas for improvement, such as specific scales, and calculate the percentage of noise that has been removed.
Matplotlib and Seaborn Overview
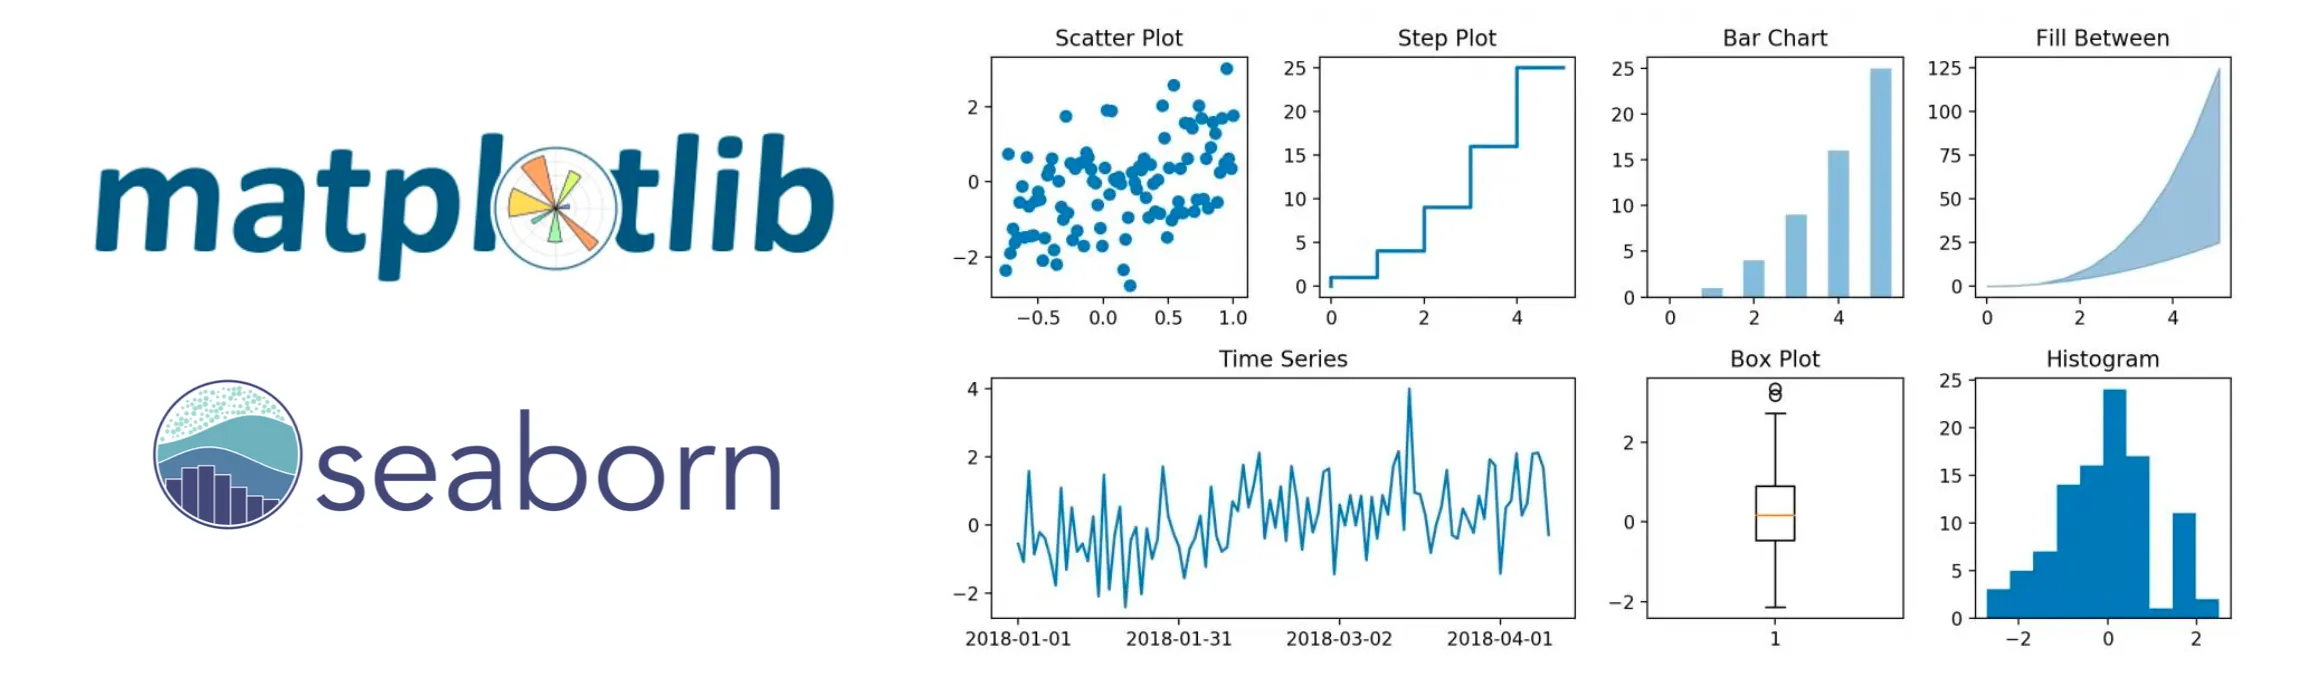
Matplotlib is a tool for data visualization using a MATLAB-like interface. Matplotlib uses the figure as its main structure, which is like a window containing visual elements. Seaborn is built on top of Matplotlib and is designed to integrate with Pandas DataFrames and create more advanced and professional-looking plots.
You can install these two libraries by using the following terminal commands: pip install matplotlib and pip install seaborn.
Matplotlib documentation — Matplotlib 3.10.0 documentation
seaborn: statistical data visualization — seaborn 0.13.2 documentation
Matplotlib Data Structures
The Figure Data Structure
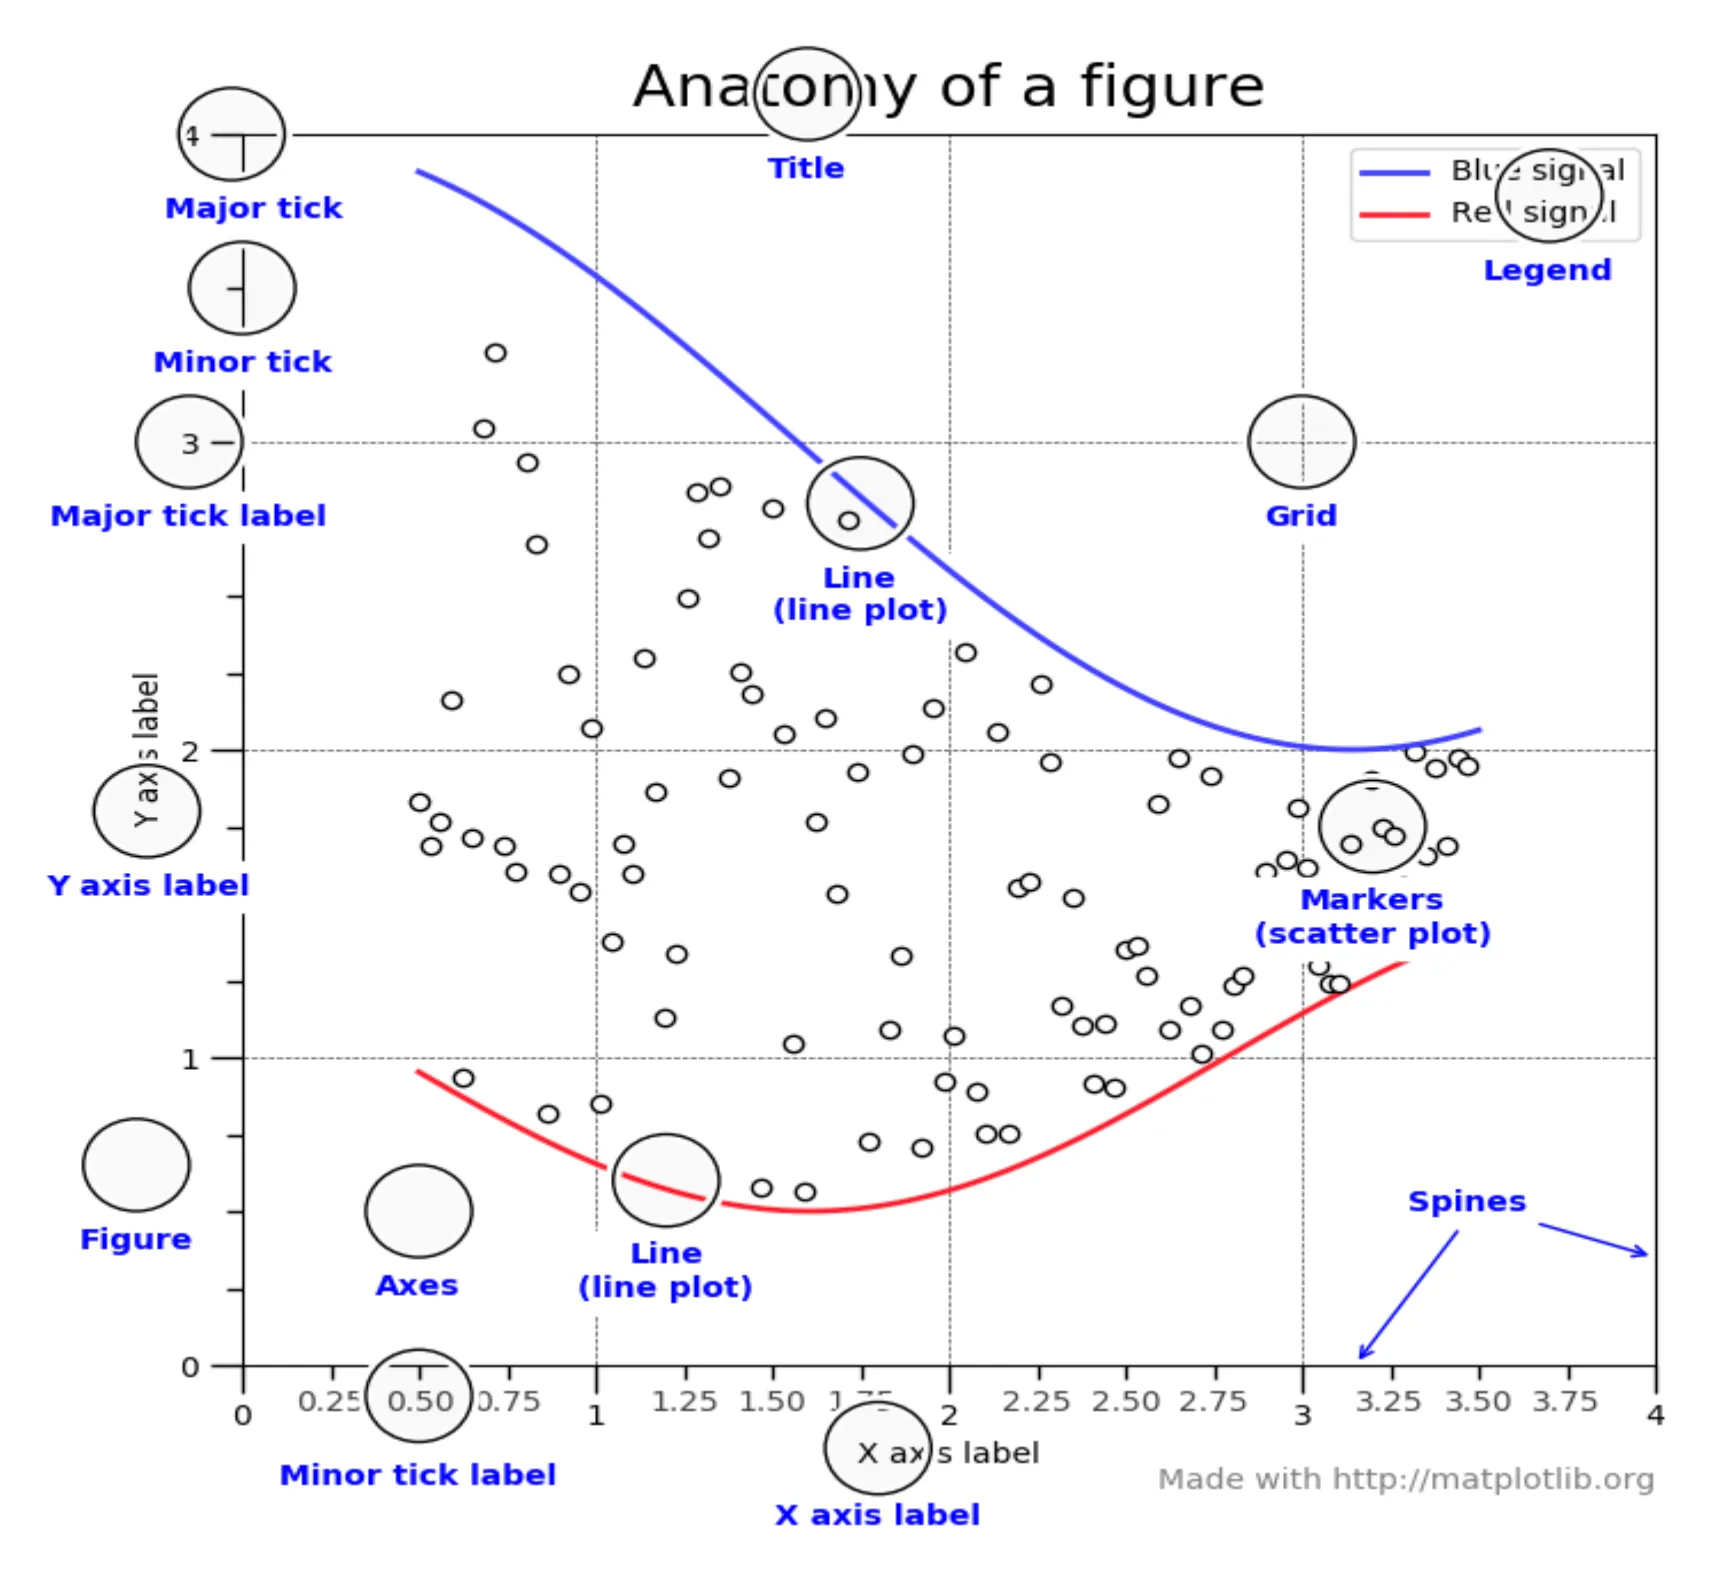
A Figure is like a window that holds all the visual elements, including axes, titles, and graphical objects on a 2D plane.
We’re going to use pyplot to perform operations with Figure.
import matplotlib.pyplot as plt
import numpy as np

xpoints = np.array([0, 6])
ypoints = np.array([12, 24])

plt.figure(figsize=(4, 3)) # (4 inch x 3 inch)
plt.title("Draw a line from (0, 12) to (6, 24)")
plt.xlabel("X-axis")
plt.ylabel("Y-axis")
plt.plot(xpoints, ypoints)
plt.show()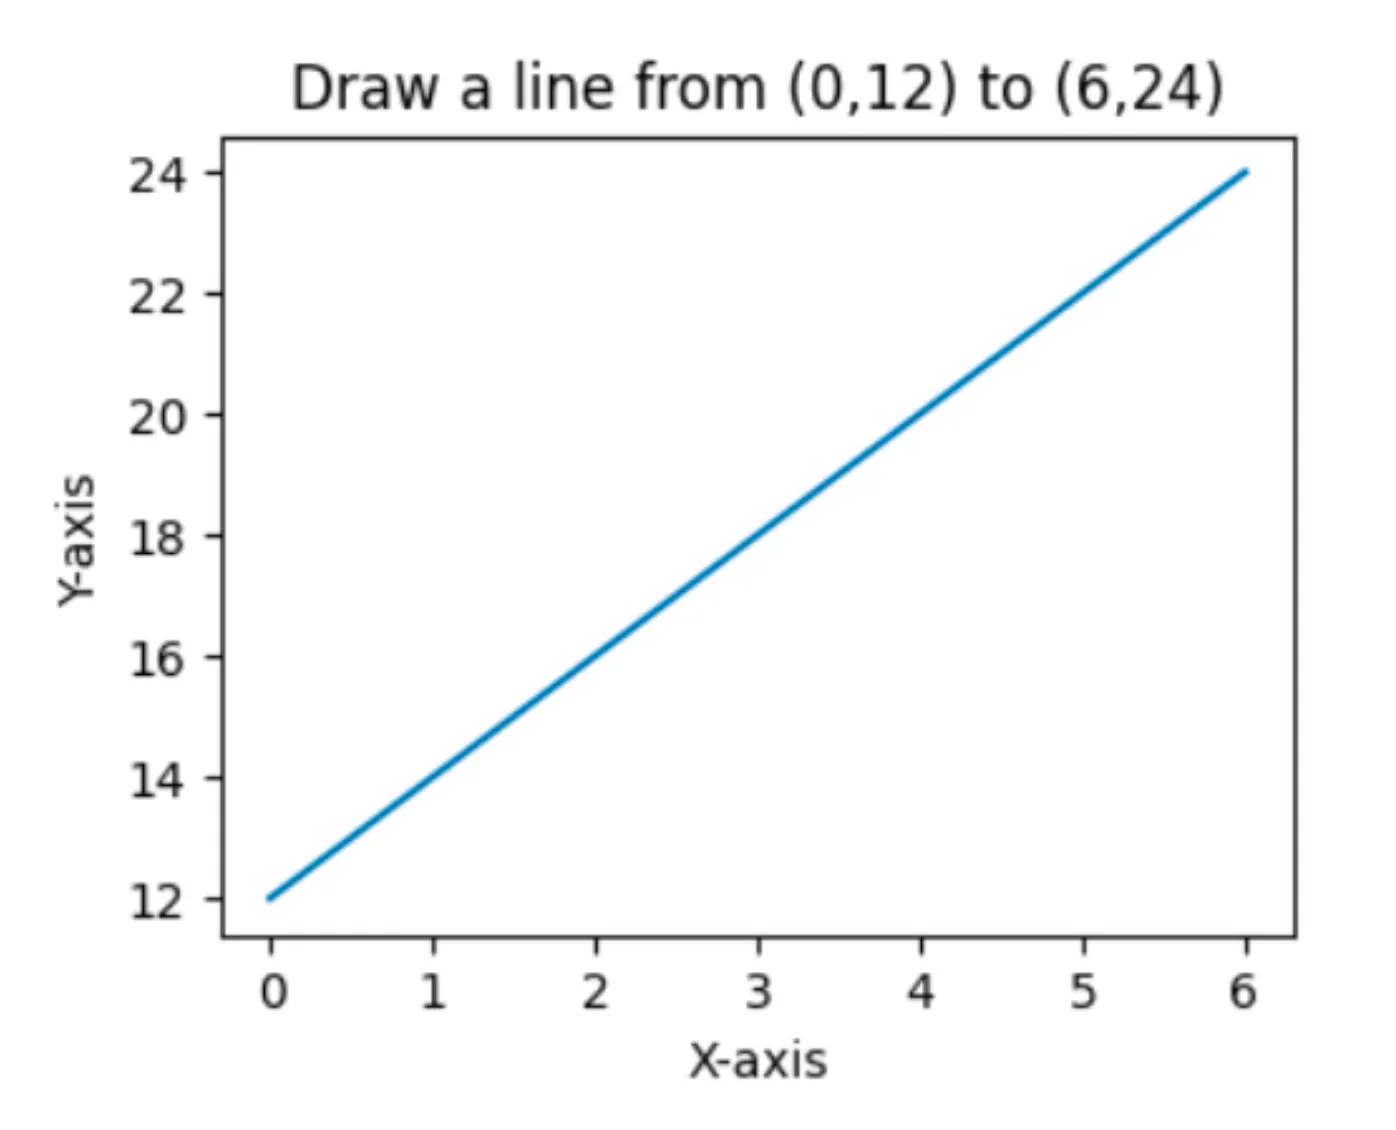
import matplotlib.pyplot as plt
import numpy as np

xpoints_a = np.array([1, 4, 6, 8])
ypoints_a = np.array([3, 8, 7, 10])
xpoints_b = np.array([1, 4, 6, 8])
ypoints_b = np.array([6, 4, 3, 12])

plt.figure(figsize=(4, 3)) # (4 inch x 3 inch)
plt.title("Draw multiple points")
plt.xlabel("X-axis")
plt.ylabel("Y-axis")
plt.plot(xpoints_a, ypoints_a, 'o', xpoints_b, ypoints_b, '^r')
plt.show()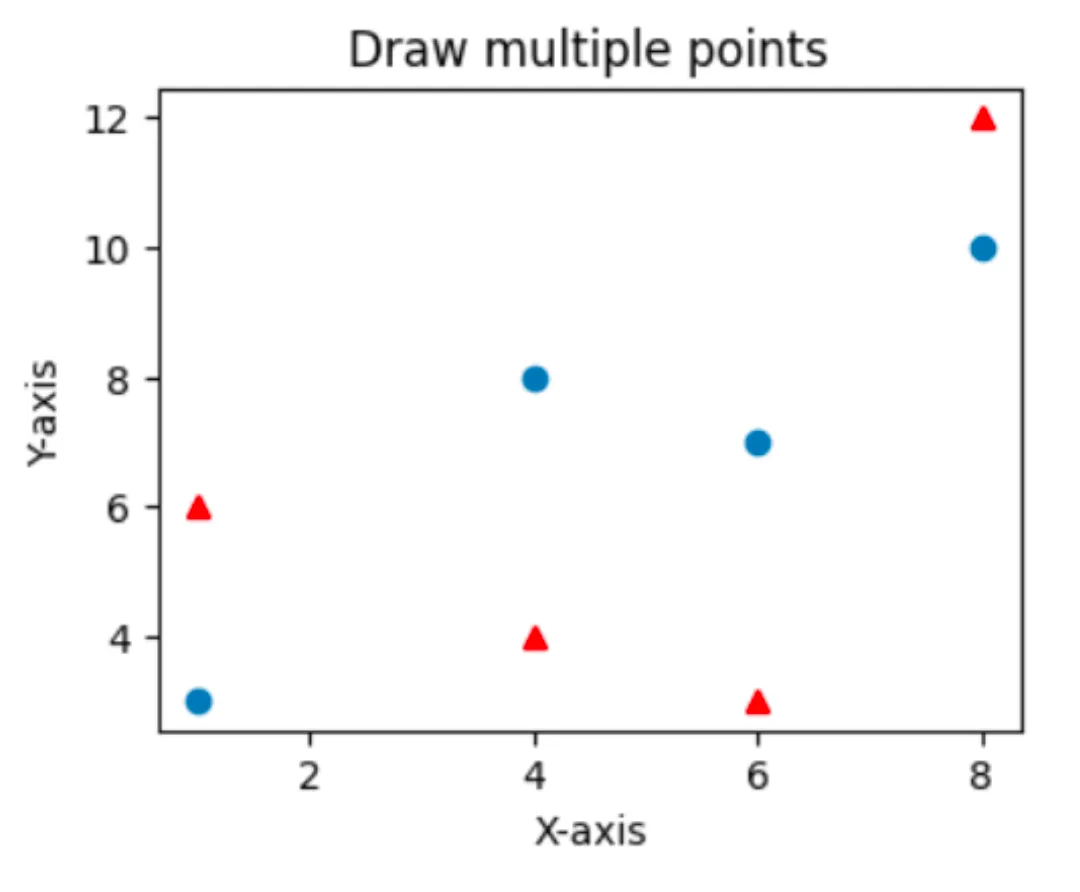
import matplotlib.pyplot as plt
import numpy as np

xpoints_a = np.array([1, 4, 6, 8])
ypoints_a = np.array([3, 8, 7, 10])
xpoints_b = np.array([1, 4, 6, 8])
ypoints_b = np.array([6, 4, 3, 12])

fig, ax = plt.subplots(nrows = 2, ncols = 1, figsize = (8, 8))
ax[0].plot(xpoints_a, ypoints_a, '-o')
ax[0].set_title("Draw lines of blue points")
ax[1].plot(xpoints_b, ypoints_b, '-^r')
ax[1].set_title("Draw lines of red points")
plt.show(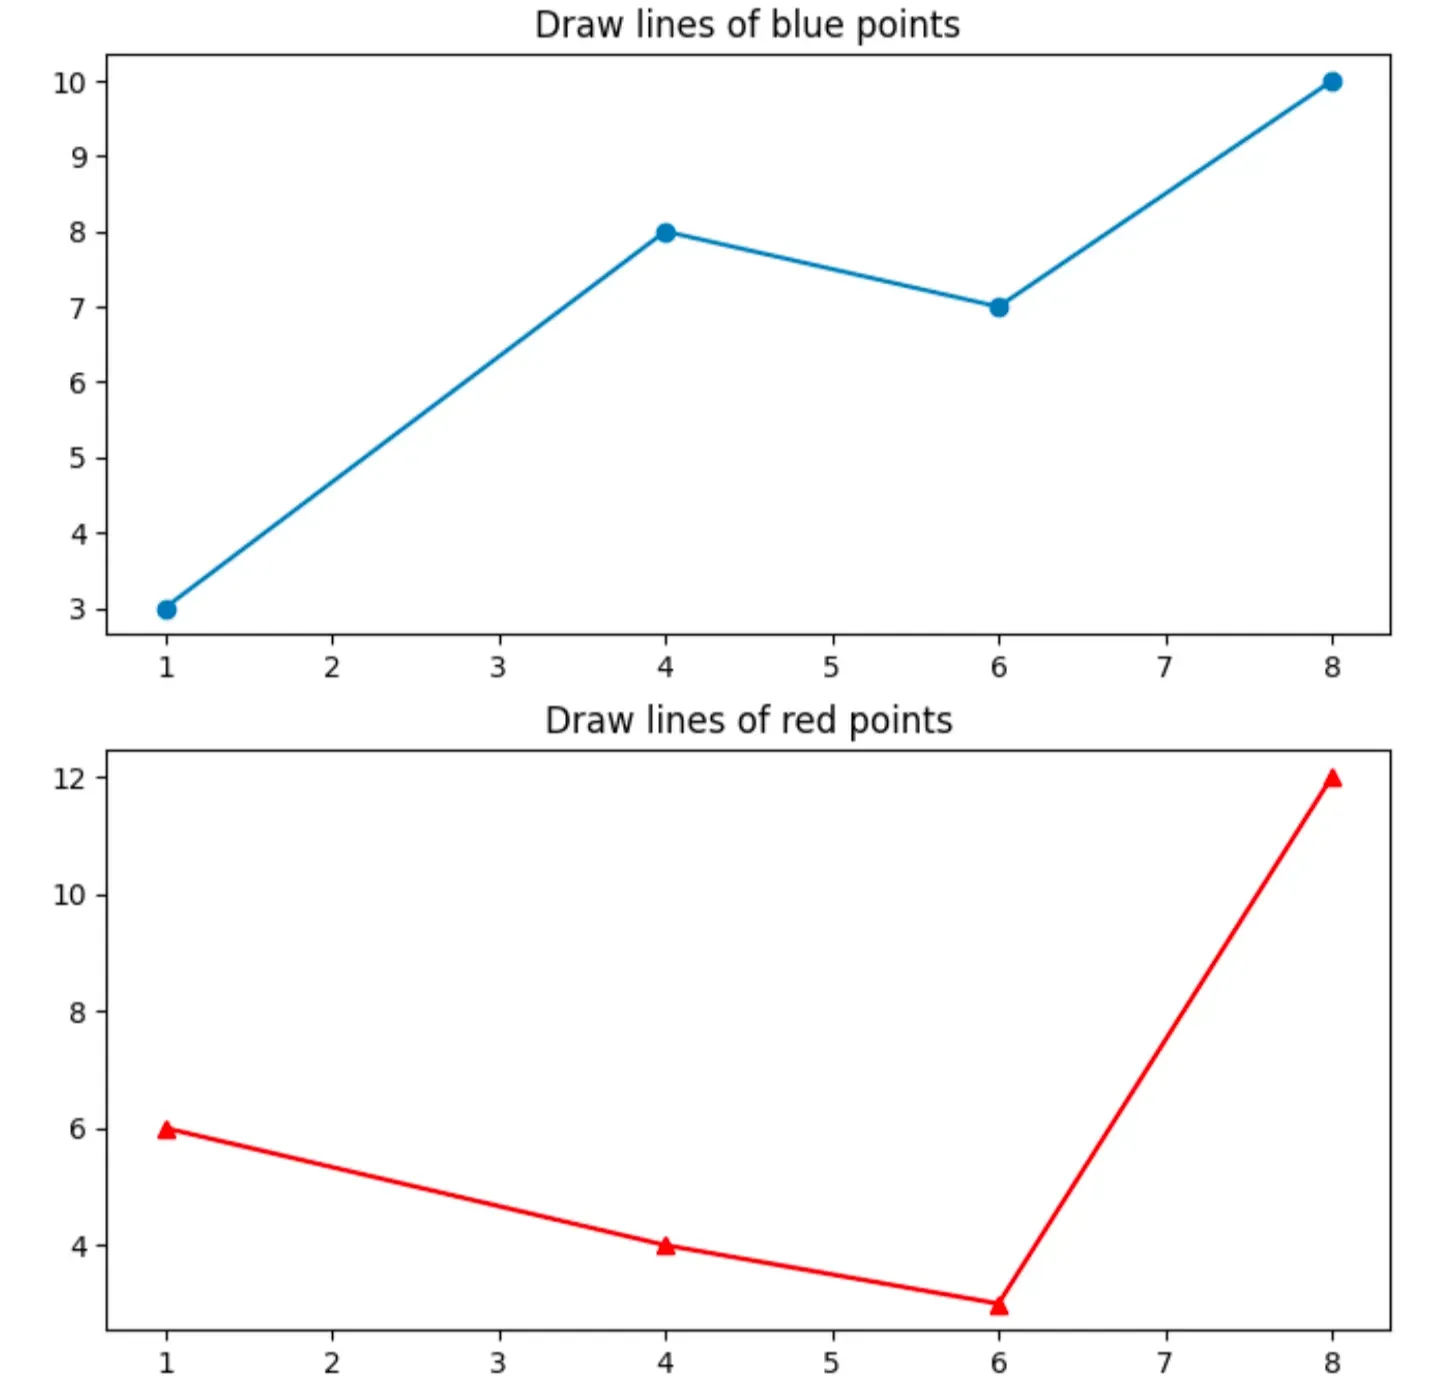
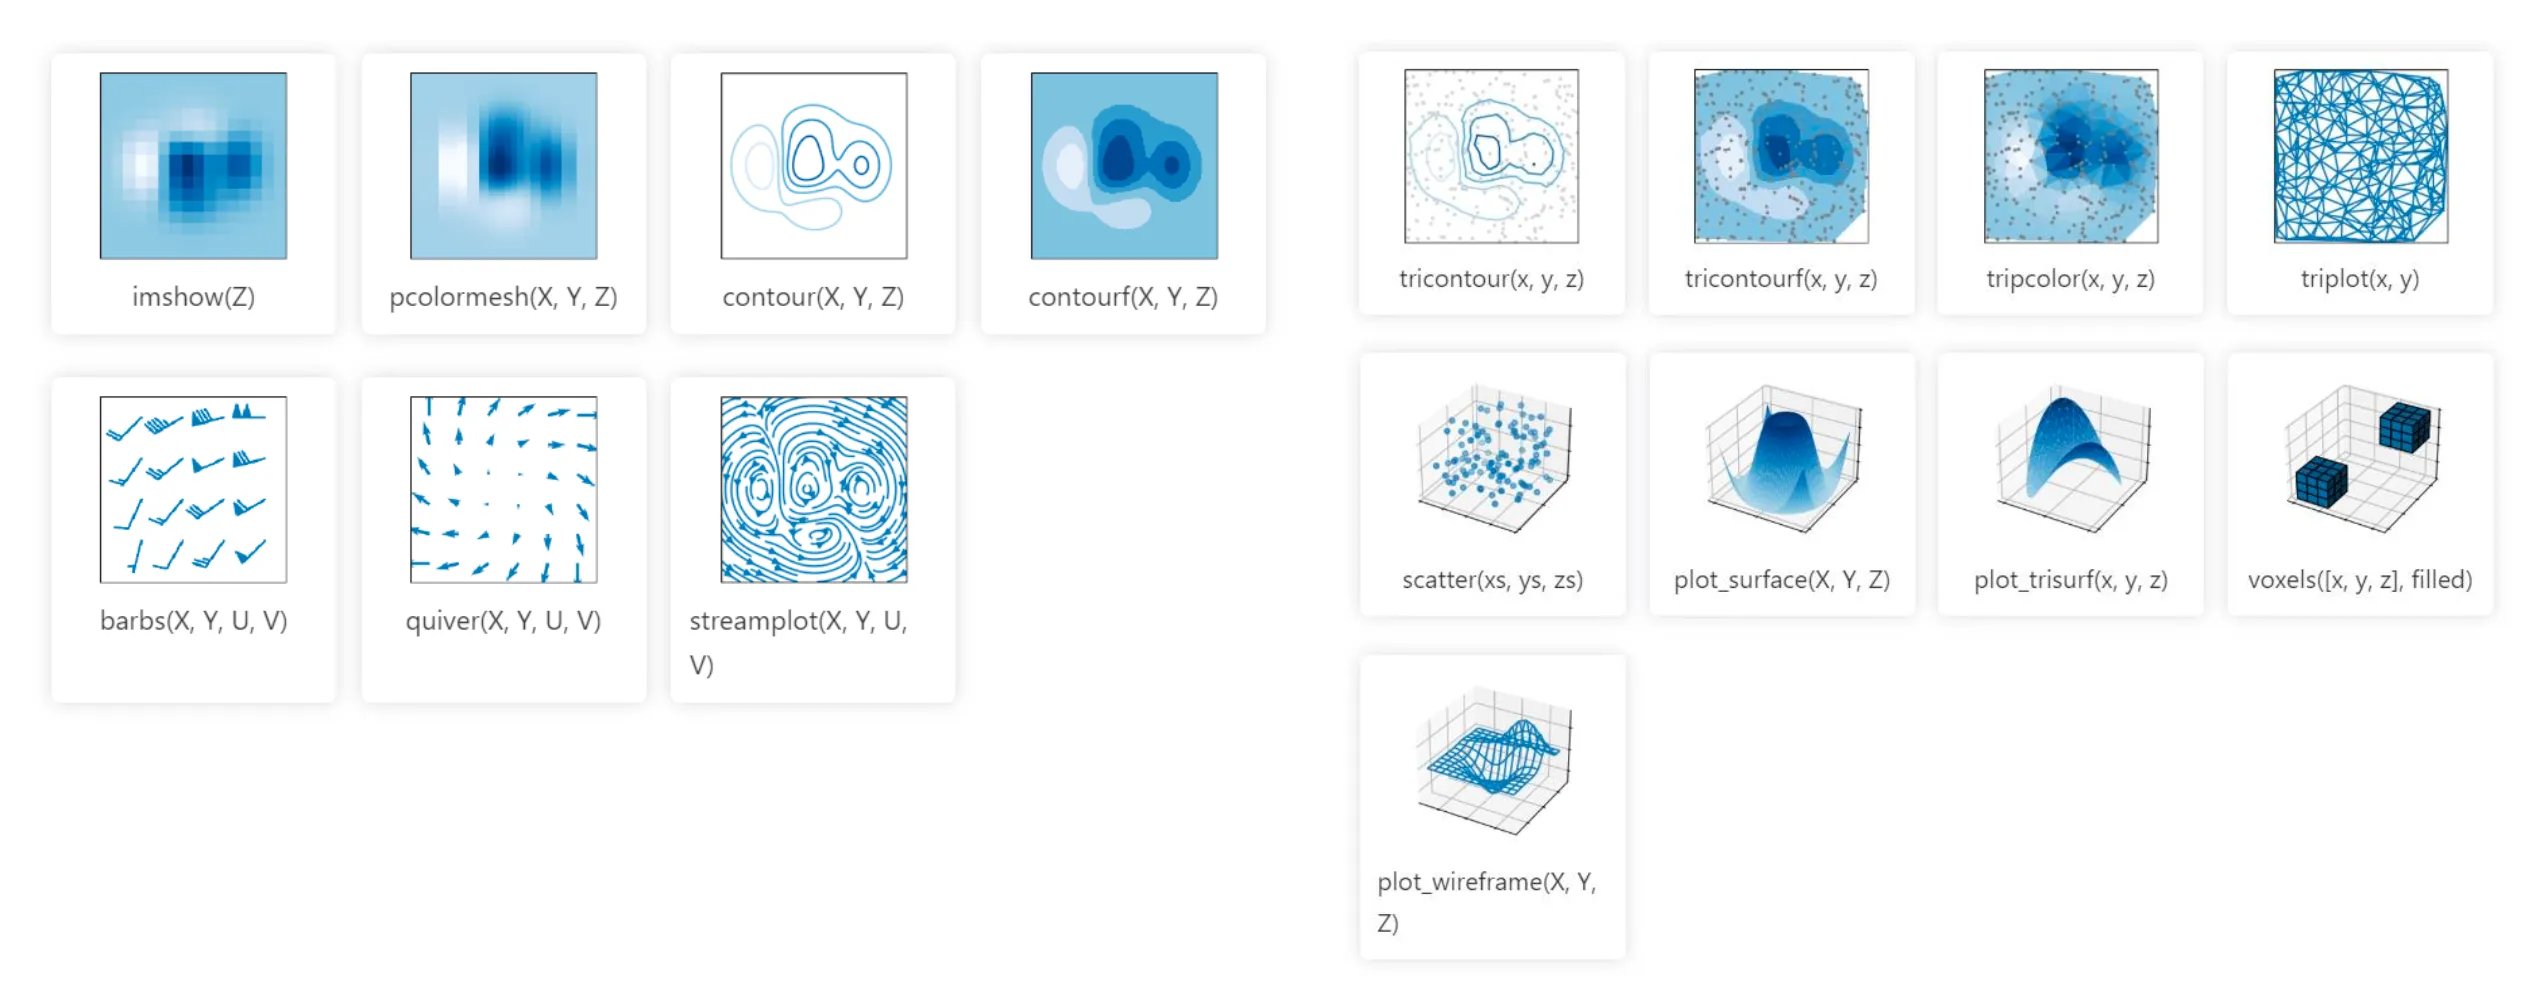
We can use Matplotlib to draw all sorts of statistical graphs or charts!
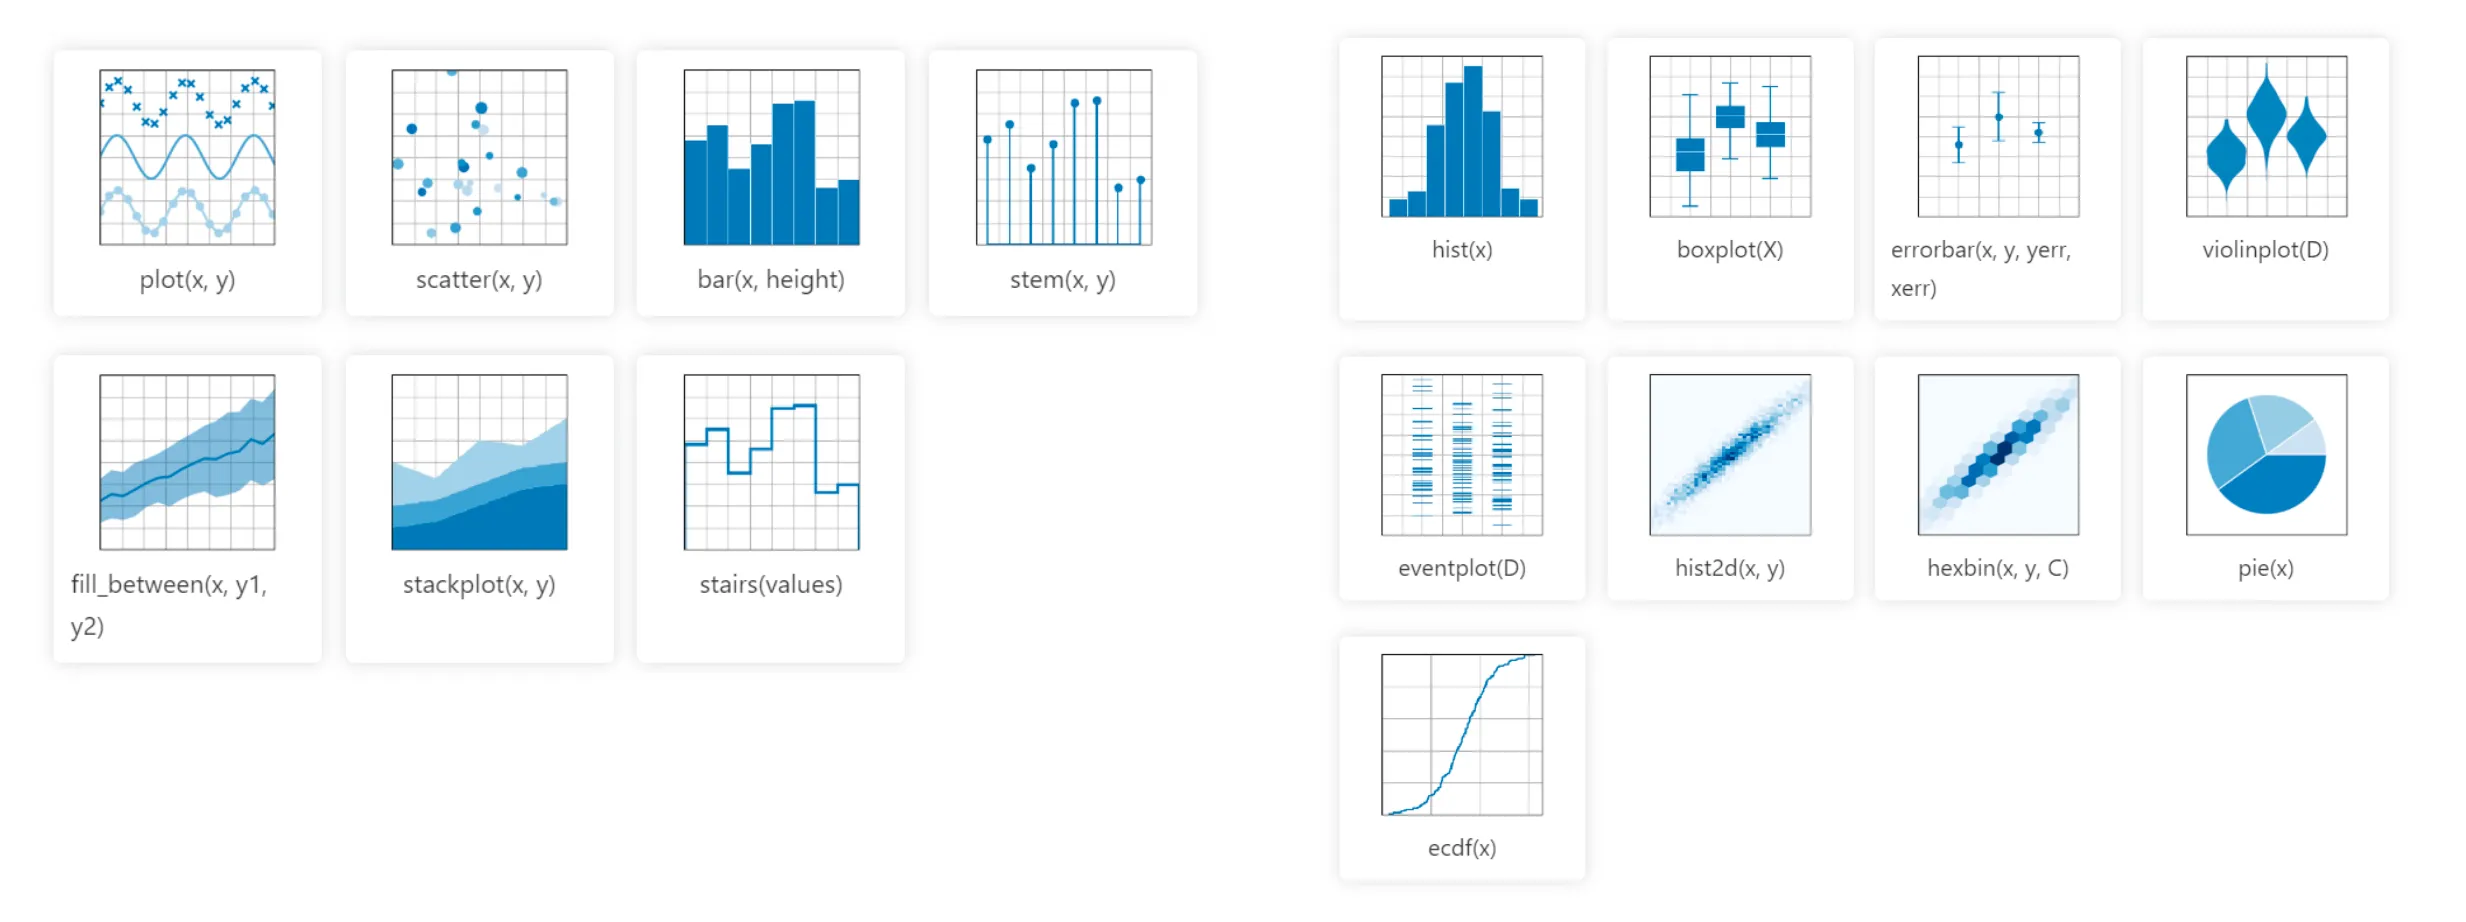
We can also depict data distributions using charts and plots!
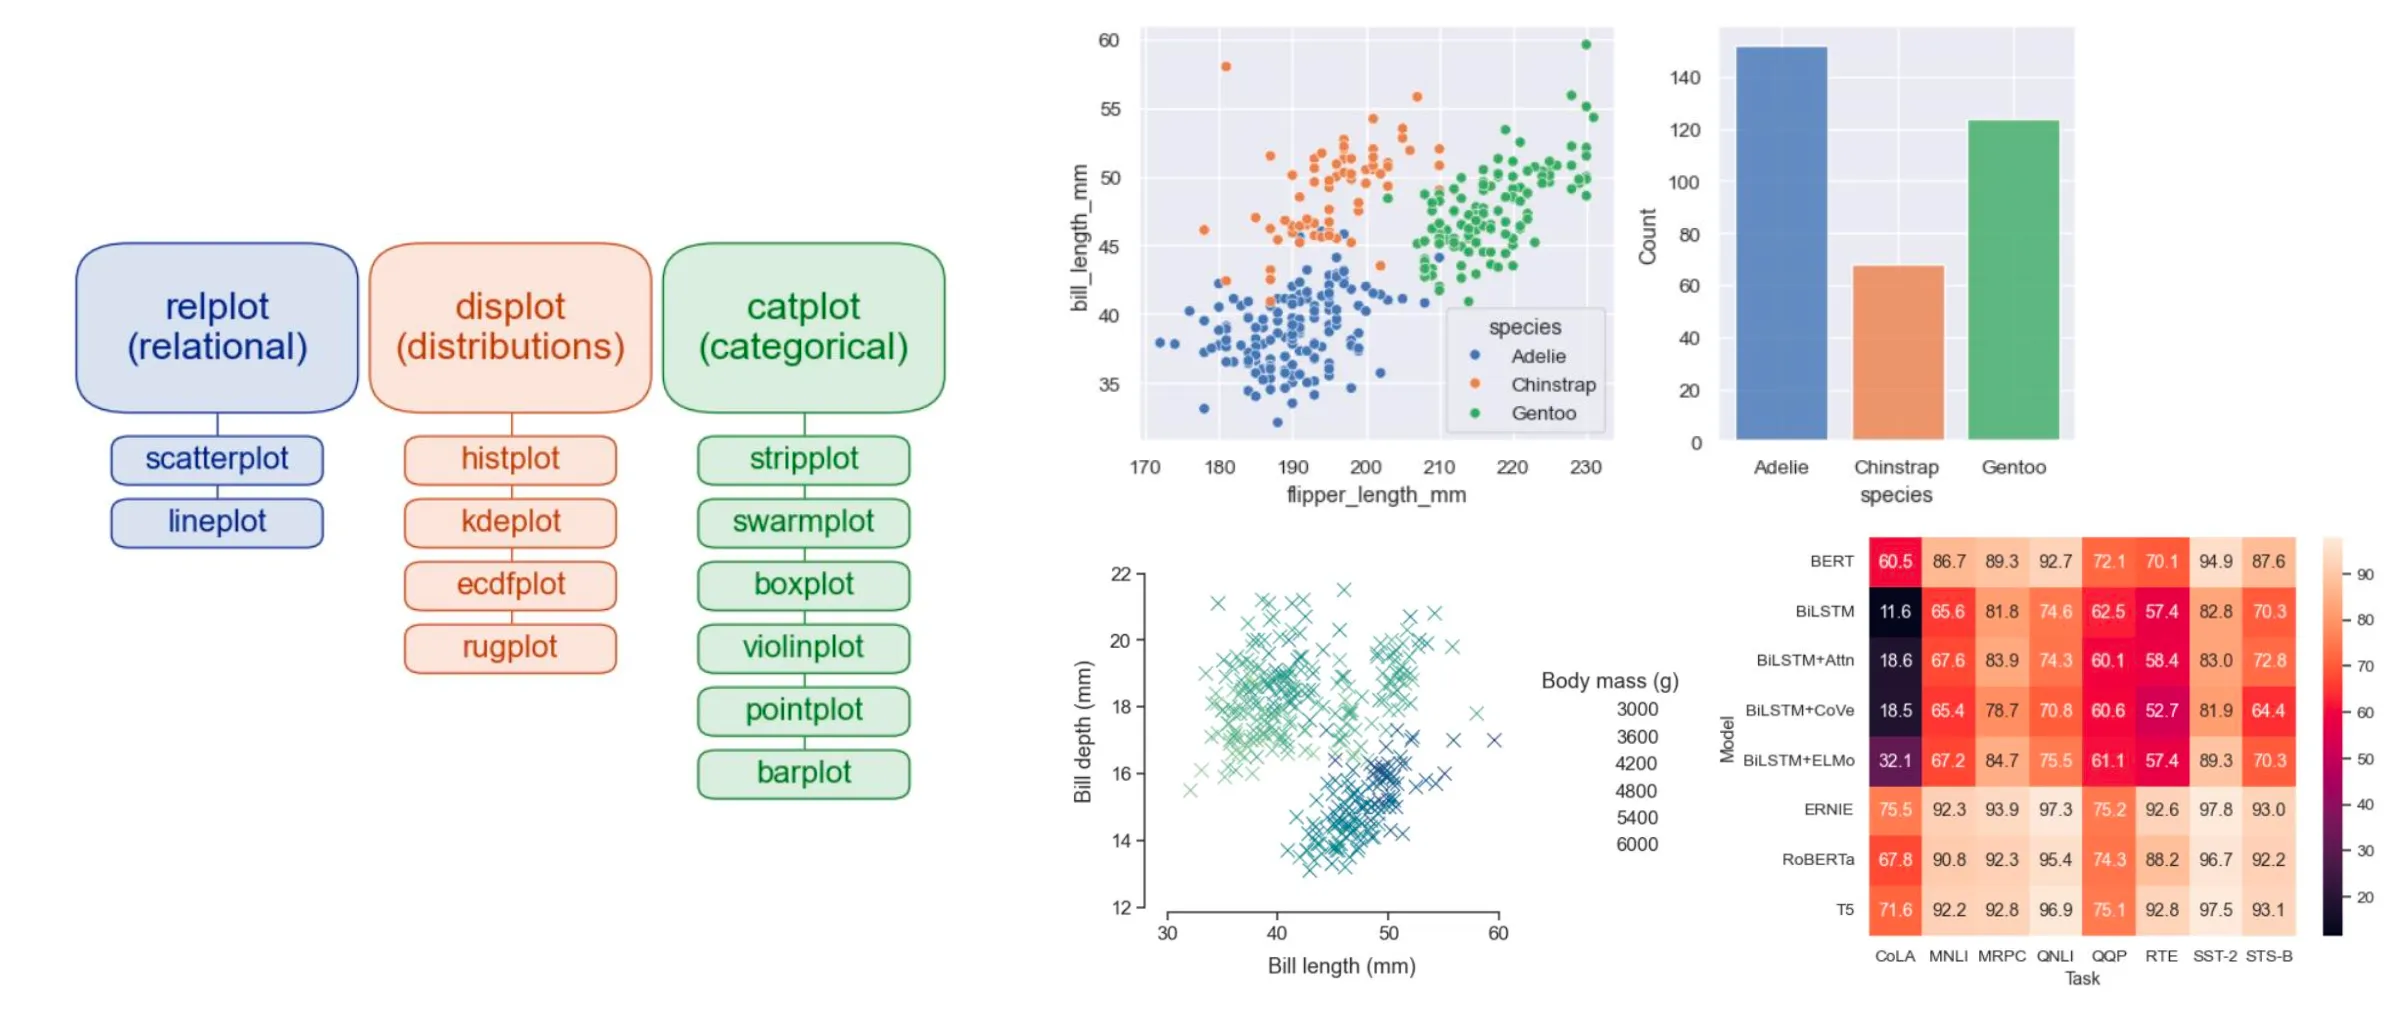
Seaborn Operations
Seaborn is designed to work with Pandas DataFrames, which simplifies the process of loading data for visualization. Seaborn provides a high-level API, which allows users to create complex and professional-looking statistical graphics with less code compared to Matplotlib. You’ll need to refer to the documentation for the usage of these APIs.
import seaborn as sns
sns.set_theme(style="darkgrid")

# Load an example dataset
df = sns.load_dataset("fmri")
sns.lineplot(x = "timepoint", y = "signal",
             hue = "region", style = "event",
             data = df)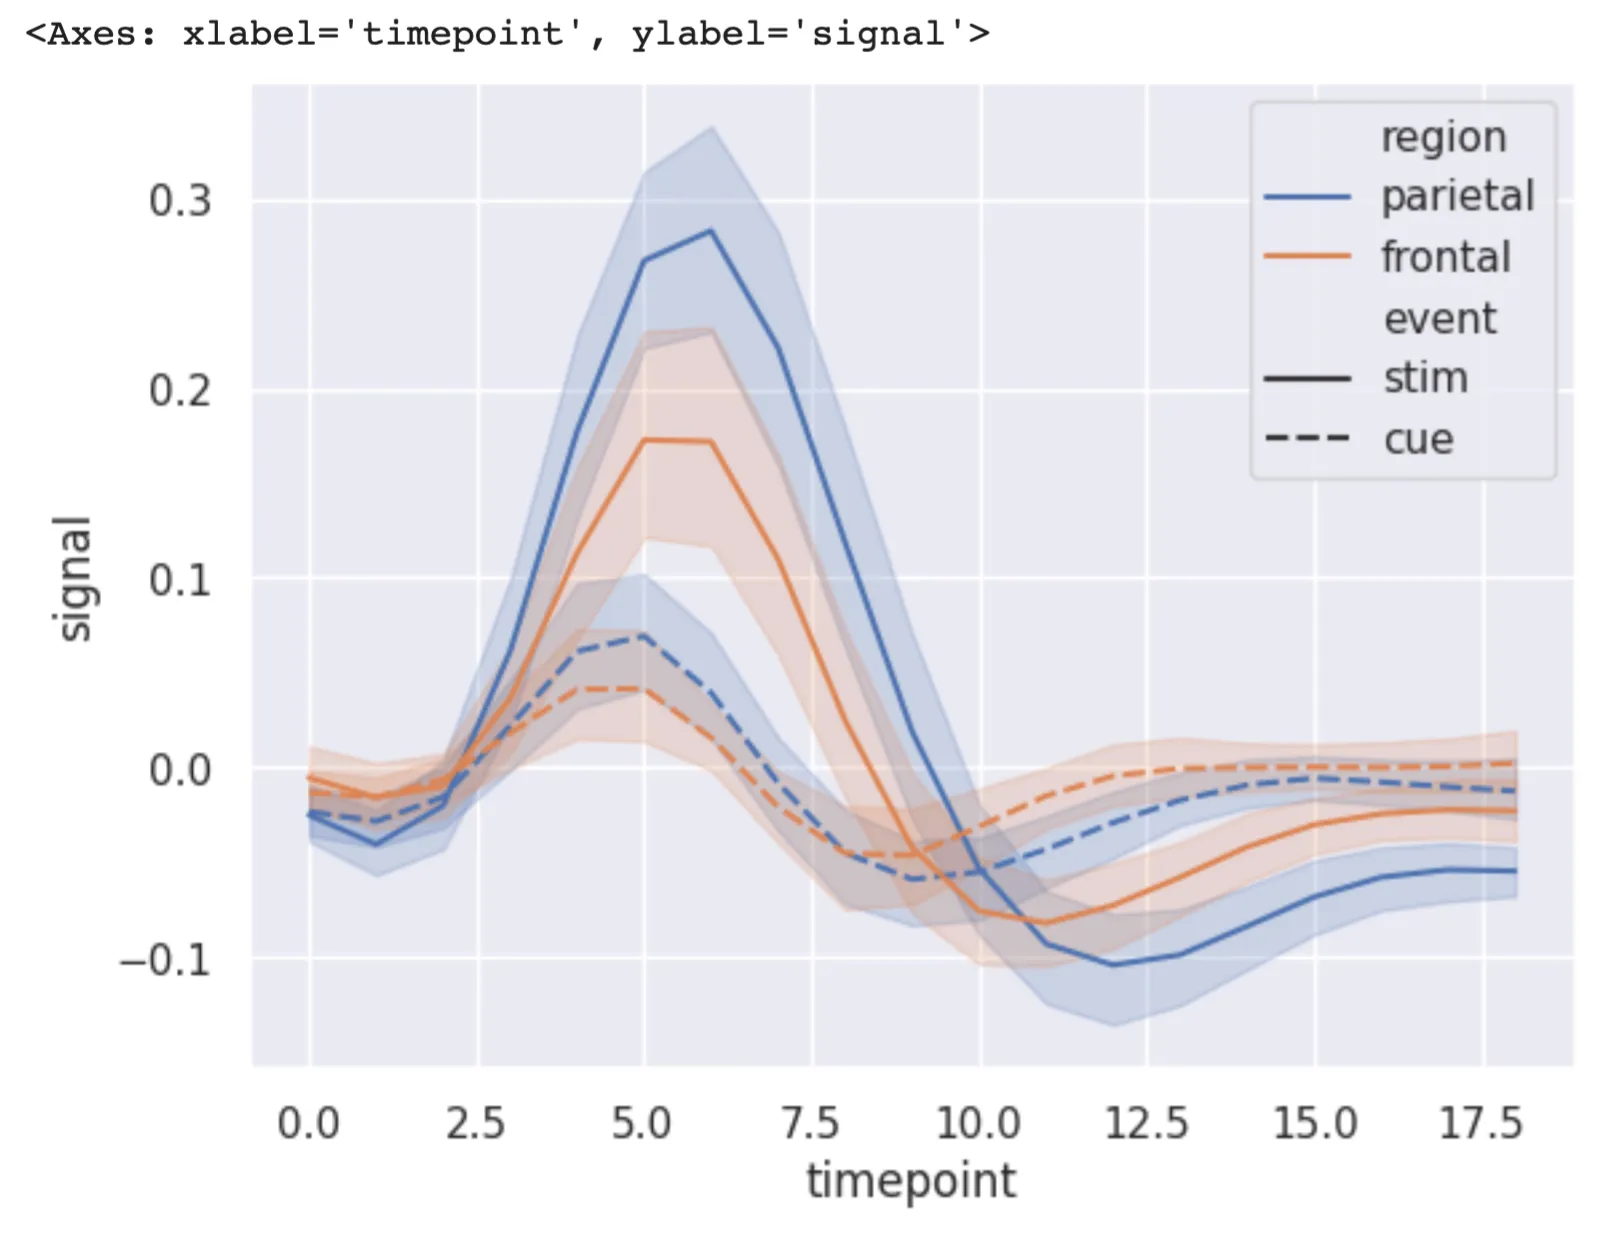
How to Effectively Use These Libraries?
To effectively utilize these libraries, remember the following:
- Understand the specific usage of each library.
- Identify the keywords relevant to your own objectives.
- Refer to the documentation of each library when needed.
👏 Thanks for reading!